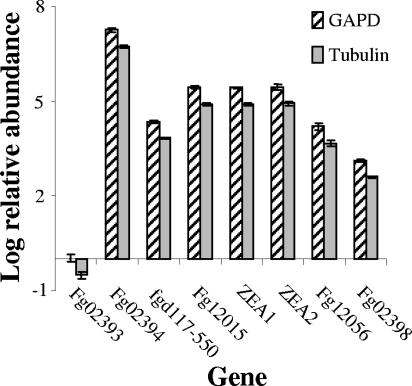
FIG. 5.
Relative expression of genes adjacent to ZEA1 and ZEA2. Shown is quantitative PCR analysis of total RNA from the wild type under ZEA-inducing conditions relative to noninducing conditions, with each normalized to GAPDH (GAPD) and β-tubulin. Data presented are the averages of three replicates and are representative of a minimum of three independent amplification events. Standard deviations are indicated.

