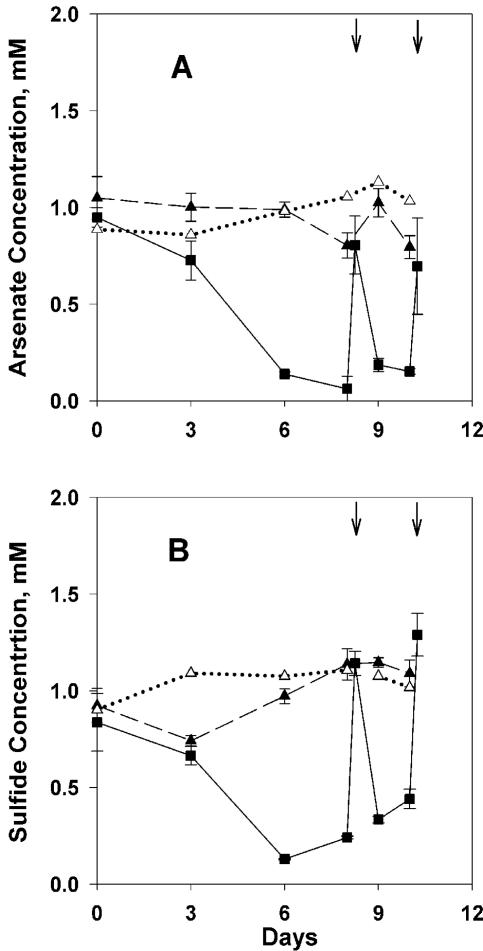
FIG. 1.
Time courses of arsenate reduction and sulfide oxidation during an experiment conducted with Mono Lake water collected on 29 May 2003 (experiment 1). (A) Arsenate concentration. (B) Sulfide concentration. Additional substrate was added to As+S treatments at the times indicated by the vertical arrows at the top of each panel. The error bars (standard deviation; n = 3 except filtered control, where n = 1) are smaller than the symbol when not shown. Solid line and filled box, As+S; dashed line and filled triangle, arsenate or sulfide alone; dotted line and open triangle, As+S filtered.

