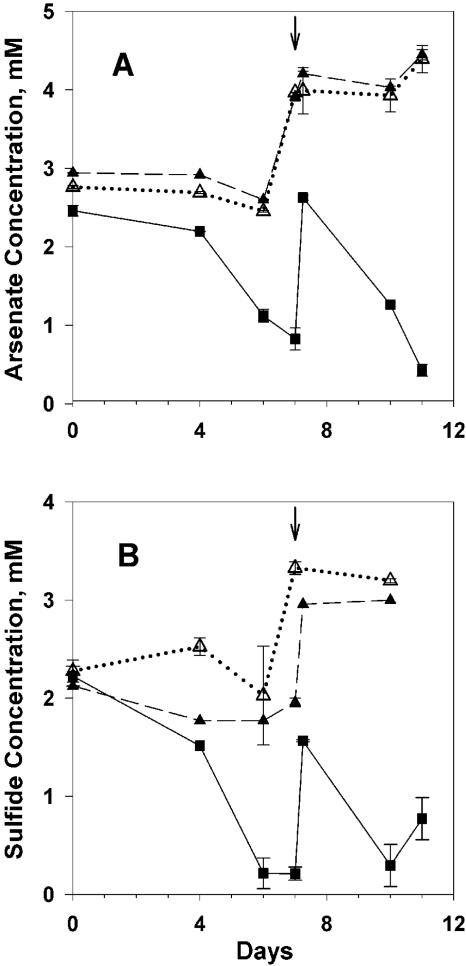
FIG. 2.
Time course of arsenate reduction and sulfide oxidation during an experiment conducted with Mono Lake water collected on 4 September 2003 (experiment 2). (A) Arsenate concentration. (B) Sulfide concentration. Solid line and filled box, As+S; dashed line and filled triangle, arsenate or sulfide alone; dotted line and open triangle, As+S filtered. Additional substrate was added to all treatments at the time indicated by the vertical arrow at the top of each panel. The error bars (range; n = 2) are smaller than the symbol when not shown.

