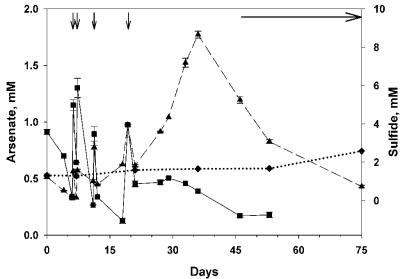
FIG. 3.
Time course of arsenate reduction and sulfide oxidation during an experiment conducted with Mono Lake water collected on 14 November 2003 (experiment 3). Additional substrate was added to As+S treatments at the times indicated by vertical arrows. The horizontal arrow indicates when precipitate was observed. The error bars (range; n = 2) are smaller than the symbol when not shown. Solid line and filled squares, arsenate in As+S treatment; dashed line and filled triangles, sulfide in As+S treatment; dotted line and filled diamonds, sulfide in As+S filtered control.

