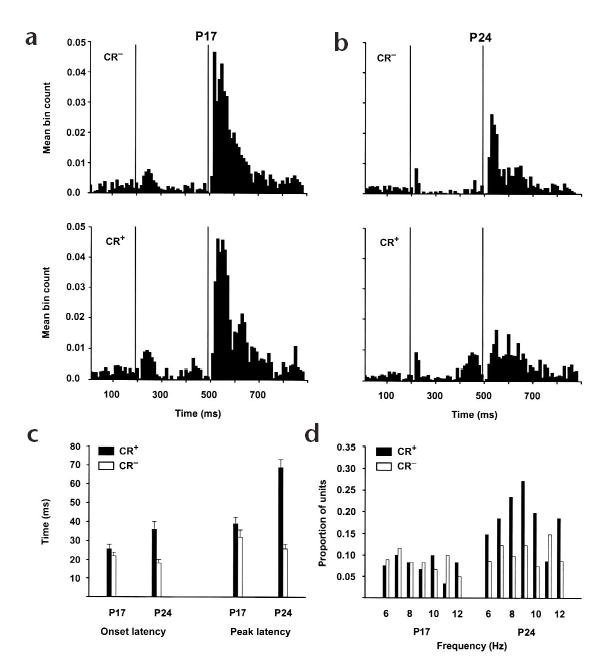
Fig. 2.

Learning-related changes in complex spike response magnitude, onset latency, peak latency and rhythmicity parallel the ontogeny of eyeblink conditioning. (a, b) Mean neuronal activity for all complex spikes recorded from Purkinje cells in lobule HVI in the P17 (a) and P24 (b) paired groups during the fifth session of conditioning on trials without (top) and with (bottom) CRs. Vertical lines indicate the onsets of the CS and US, respectively. (c) Mean onset and peak latencies for complex spikes recorded during the fifth conditioning session in the paired groups on trials with (black bars) and without (white bars) CRs. (d) Distribution of the proportions of complex spikes recorded during the fifth conditioning session in the paired groups that exhibited significant autocorrelations at each frequency (time lag−1) during trials with (black bars) and without (white bars) CRs.
