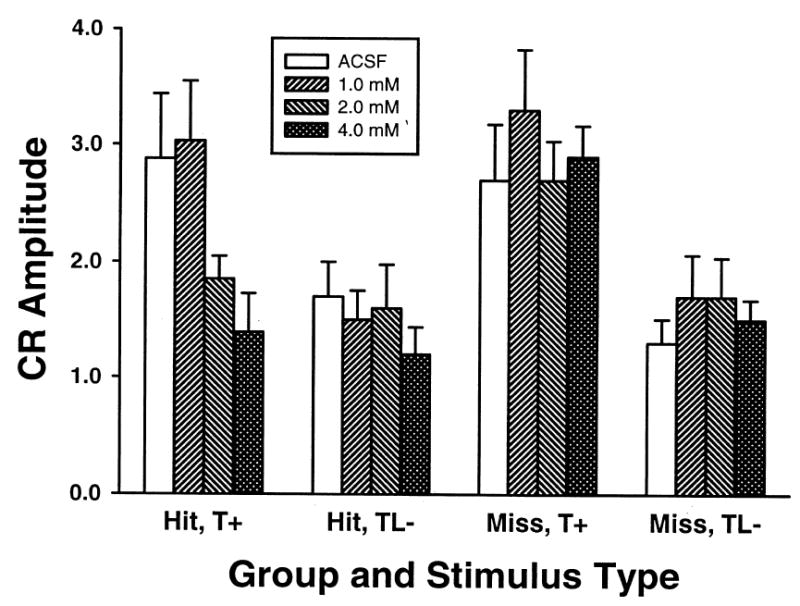
Fig. 4.

Mean (+ SEM) CR amplitude for both cannula hit (left two sets of bars) and miss (right two sets of bars) groups. CR amplitudes are shown by trial type across doses of picrotoxin and ACSF. Tone-shock trials (T+, left) and tone-light-no shock trials (TL−, right) are displayed separately for each group. Shading indicates ACSF or dose of picrotoxin (from left to right: ACSF, 1.0 mM, 2.0 mM, 4.0 mM).
