
Figure 1.
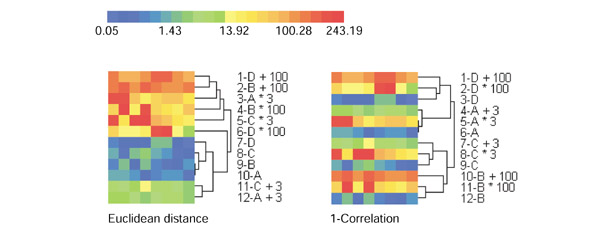
Differences between Euclidean distance and correlation in hierarchical cluster analysis (HCA) of expression for four genes (A, B, C and D) to which constant values of 3 and 100 were added or multiplied. Euclidean distance did not ignore additive and multiplicative translations from base values of A, B, C and D. However, correlation ignored translations because the correlation between a profile and that same profile to which a constant is added or multiplied is unity. The lengths of dendogram arms shown relate to joining step rather than joining distance.