
Figure 2.
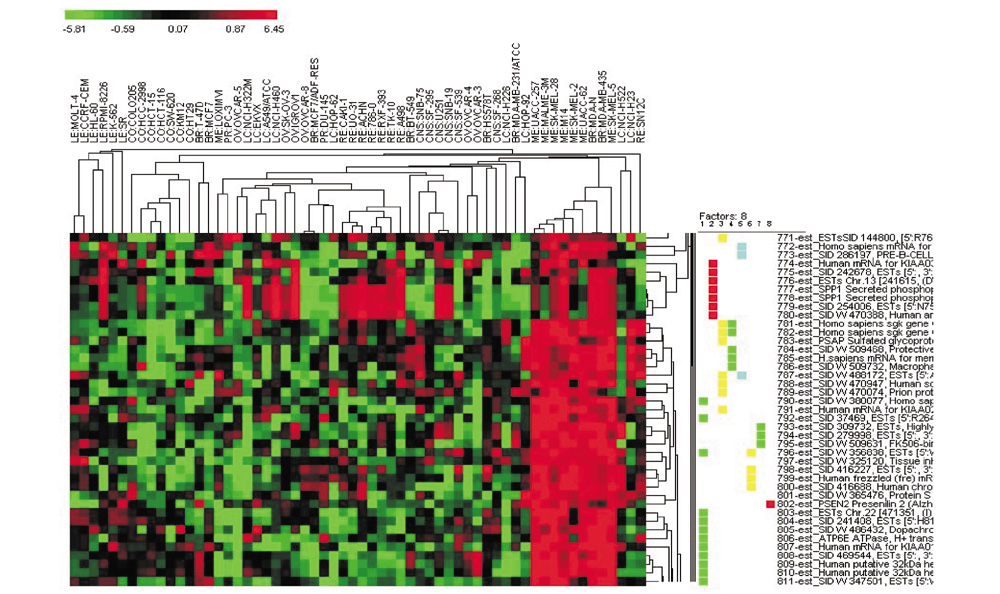
HCA results showing cluster image display for selected genes with color gradient for standardized gene expression and dendograms for arrays and genes. Results of principal-component analysis (PCA) on the selected genes are shown on the right. Data from Ross et al. [10. Expression data were standardized (color is z-score based on array average and standard deviation). The distance function is based on Euclidean distance.