
Figure 5.
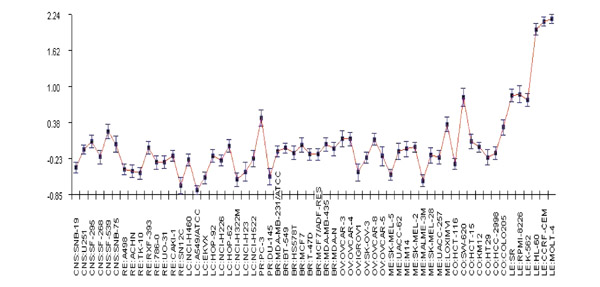
PCA results showing average and standard deviation of standardized expression values for the same N = 29 genes shown in Figure 4. Note that these genes were mostly upregulated in leukemia cell lines.
Official websites use .gov
A
.gov website belongs to an official
government organization in the United States.
Secure .gov websites use HTTPS
A lock (
) or https:// means you've safely
connected to the .gov website. Share sensitive
information only on official, secure websites.
PCA results showing average and standard deviation of standardized expression values for the same N = 29 genes shown in Figure 4. Note that these genes were mostly upregulated in leukemia cell lines.