
Figure 6.
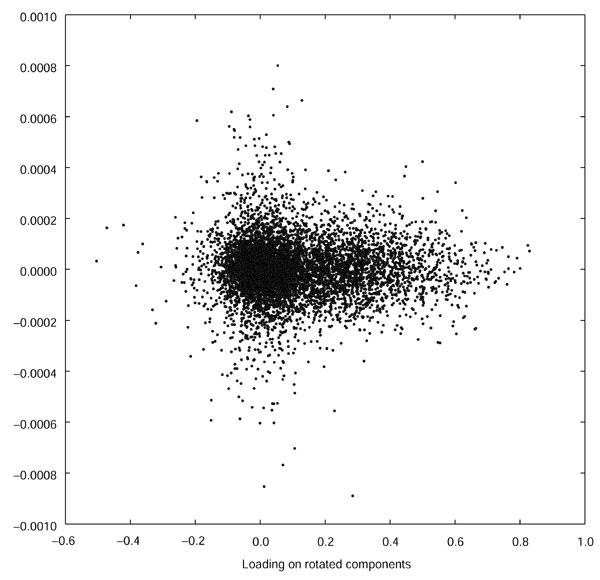
PCA bias showing difference between SPSS and CLUSFAVOR results for loadings of 300 gene-expression profiles on 24 rotated components (Varimax). Plot indicates that less than a 0.001 bias in loadings was obtained from a run containing 300 genes with 60 arrays.