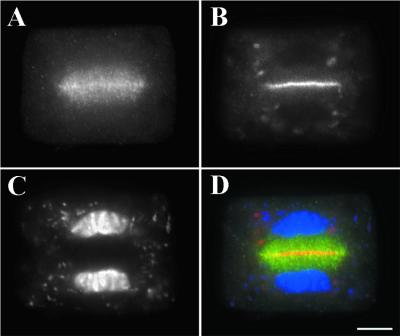
Figure 9.
Distinct Localization Patterns of AtPAKRP2 and KNOLLE in the Phragmoplast.
Triple localizations were performed with anti–AtPAKRP2-T (A), anti-KNOLLE (B), and DAPI (C) in B. oleracea cells undergoing cytokinesis as revealed by the appearance of the daughter nuclei (C). The composite image (D) was pseudocolored, with AtPAKRP2 shown in green, KNOLLE shown in red, and DNA shown in blue. Bar in (D) = 5 μm for (A) to (D).

