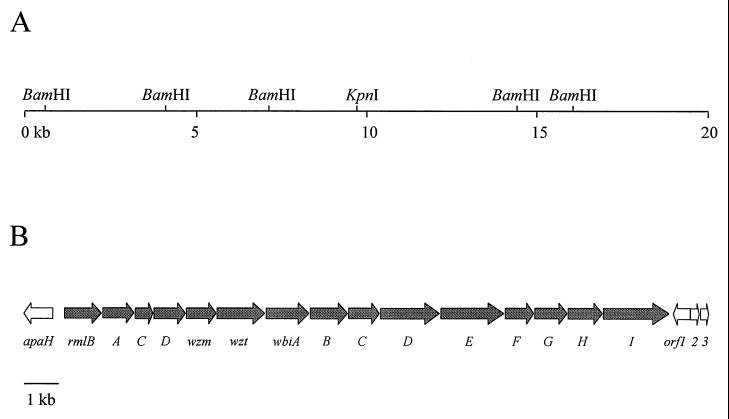
FIG. 2.
Restriction and genetic maps of the B. mallei O-PS biosynthetic gene cluster. (A) Restriction map. The horizontal line represents the B. mallei DNA insert of cosmid 2B5. The locations of BamHI and KpnI cleavage sites used for subcloning are shown. Two additional BamHI sites at the 5′ and 3′ ends of 2B5, which were part of the pScosBC1 vector, are not shown. (B) Genetic map. The location and direction of transcription of the genes are represented by arrows, and the gene names are shown below. The gray arrows indicate the genes involved in O-PS biosynthesis based on homology to the B. pseudomallei O-PS biosynthetic operon.

