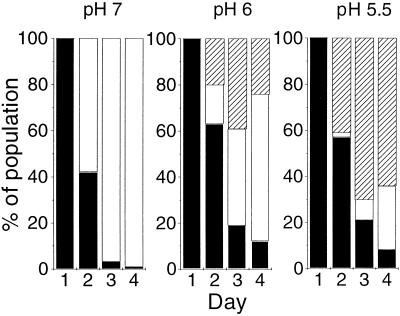
FIG. 4.
Effect of pH stress on rpoS mutations. Chemostat cultures of strain BW2952 growing at a dilution rate of 0.3 h−1 were grown in minimal medium whose pH was adjusted to pH 7, 6, and 5.5. At the same time each day, samples were tested for the proportion of glycogen-containing (rpoS+) cells as described for Fig. 1. Black bars represent wild-type bacteria, white bars represent null mutants, and hatched bars represent partial mutants. The pattern shown is representative of that for three replicate populations under each pH condition.

