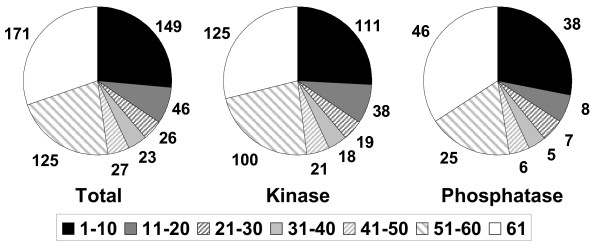
Figure 4.
Tissue restriction of protein kinases and phosphatases. Counts were made of the number of tissues a given gene was detected in (above 200). Then genes were divided into bins of size 10, where bin 1–10 corresponded to genes detected in 10 or fewer tissues. Bin 61, corresponds to the fraction detected in all 61 tissues.

