
Figure 12.
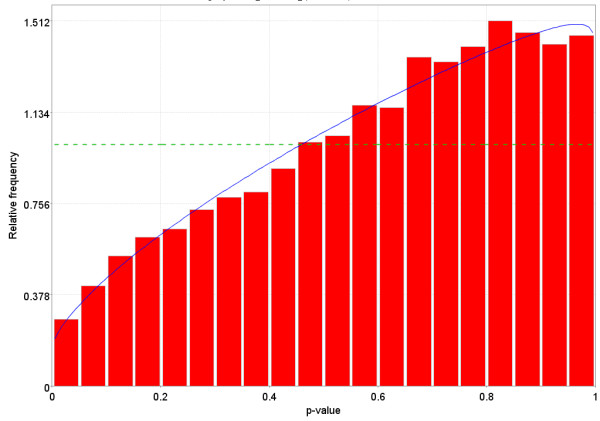
Distribution of p-values for a dataset in GEO that does not follow one of the possible distributions for p-values. The dotted Blue line is the expected distribution of p-values if the treatment has no effect and the solid Green line is the mixed-model [23] fit of the p-value constrained to be monotonically non-decreasing.