
Figure 14.
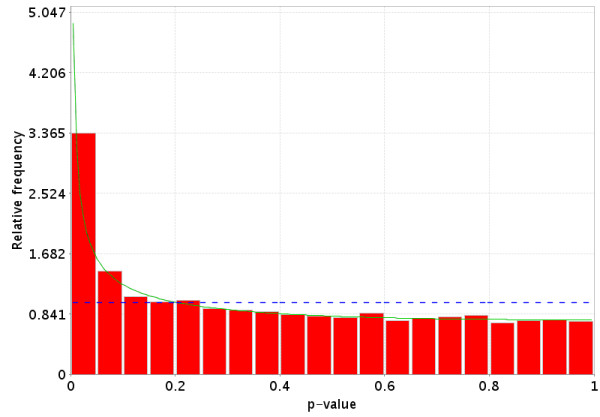
Distribution of p-values for the comparison of RNA from 7 mice with PKDH mutations and a high kidney length to width ratio and RNA from 7 mice with PKDH mutations and a low kidney length to width ratio. The dotted blue line is the expected distribution of p-values if the treatment has no effect and the solid green line is the mixed-model [23] fit of the p-value constrained to be monotonically non-decreasing.