
Figure 9.
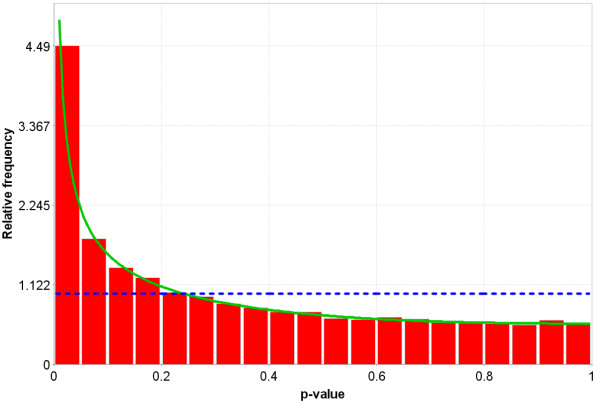
Distribution of p-values when there is a difference in the gene expression between the two groups for some of the genes, but not all of the genes. This distribution is monotonically non-increasing from 0 to 1. The dotted Blue line is the expected distribution of p-values if the treatment has no effect and the solid Green line is the mixed-model [23] fit of the p-value constrained to be monotonically non-decreasing.