
Fig. 3.
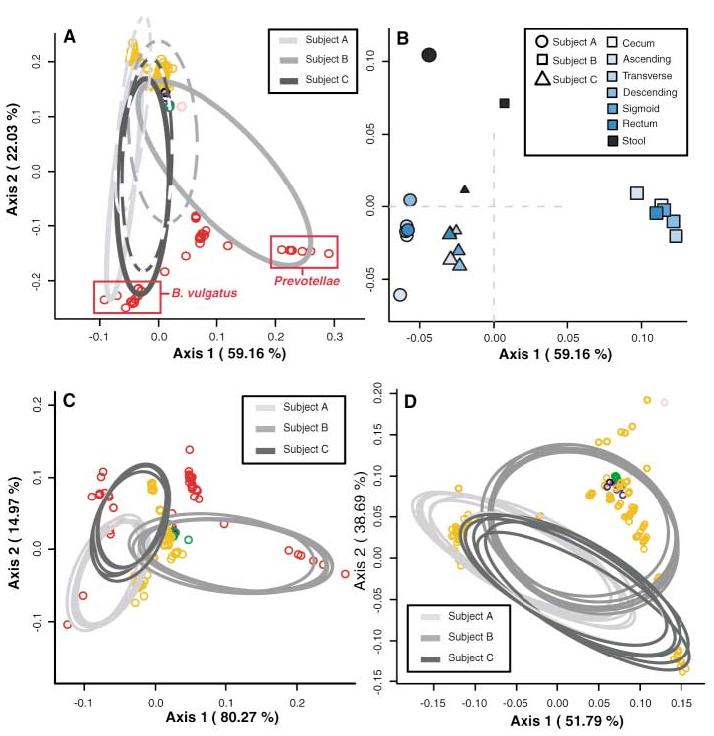
DPCoA for (A) colonic mucosa (solid lines) and stool (dashed lines), (C) colonic mucosal sites alone, and (D) mucosal sites excluding Bacteroidetes phylotypes. Phylotypes are represented as open circles, colored according to phylum as in Fig. 1. Phylotype points are positioned in multidimensional space according to the square root of the distances between them. Ellipses indicate the distribution of phylotypes per sample site, except in (A), where all mucosal sites are represented by one ellipse. Percentages shown along the axes represent the proportion of total Rao dissimilarity captured by that axis. (A) is the best possible two-dimensional representation of the Rao dissimilarities between all samples (12). (B) is an enlarged view of (A), depicting the centroids of each site-specific ellipse. Subject ellipse distributions remain distinct after stool phylotypes (C) and Bacteroidetes phylotypes (D) are excluded from the analysis.