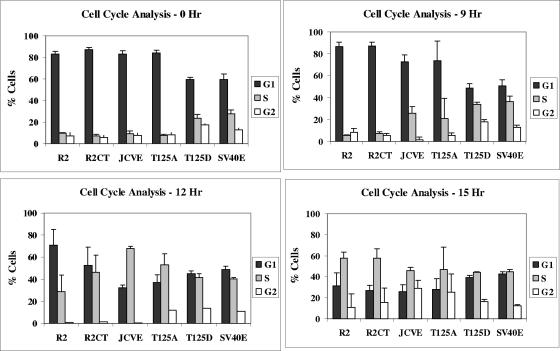
FIG. 7.
Cell cycle analysis of R2-T125A and R2-T125D mutant cell lines. Rat 2 (R2), R2CT, R2-JCVE, R2-T125A, R2-T125D, and R2-SV40E cells (2.2 × 10⁵) were seeded into six-well (35-mm) plates. After 3 h, the medium was replaced, and cells were incubated in DMEM containing 0.01% BCS to induce growth arrest. After 72 h, cells were then refed with DMEM containing 10% BCS and analyzed for cell cycle progression 0, 9, 12, and 15 h after serum stimulation. The percentages of cells in the G1, S, and G2/M phases for each cell line at each time point were determined by using an XL-MCL Coulter machine (Center for Quantitative Cell Analysis, Penn State University). Results from one of three independent experiments are shown.

