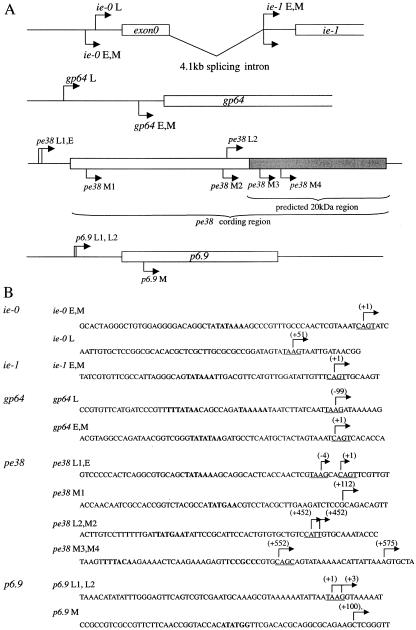
FIG. 2.
Mapping of the 5′ ends of the transcripts for ie-1 and ie-0, gp64, and pe38 in Sf9 and HeLa14 cells at 48 hpi. (A) Schematic representation of the gene structure for ie-1 and ie-0, gp64, and pe38. The open box shows the open reading frame. Arrows on the diagram for each gene indicate the initiation sites in Sf9 cells at the early (E) or late (L) stage and in HeLa14 cells (M), respectively. (B) Sequences around the transcription initiation sites in Sf9 cells and HeLa14 cells. The arrow shows the transcription initiation site and the number in parenthesis indicates the nucleotide position relative to the transcription initiation site in Sf9 cells (+1) at the early stage (for ie-0 [16]), ie-1 (25), gp64 (9), and pe38 (20) or the late stage (for p6.9 [this paper]). The CAGT early motif and the TAAG late motif are underlined. Boldface type indicates TATA-box like and BRE-like sequences.

