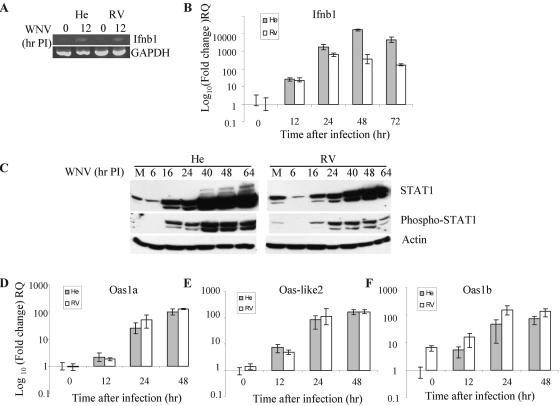
FIG. 2.
Induction of IFN-β and Oas gene expression and STAT1 phosphorylation in WNV-infected RV and He MEFs. Total cell RNAs were purified from primary RV and He MEFs that had been either mock infected or infected with WNV at an MOI 10 for 12, 24, 48, or 72 h. The RNA was subjected to semiquantitative RT-PCR (A) or real-time RT-PCR (B). Real-time RT-PCR was performed with inventoried TaqMan Gene Expression Assays (Applied Biosystems) for the gene for IFN-β and for the endogenous control gene, GAPDH. (C) Western blot analysis of STAT1 and phosphorylated STAT1. Cell lysates were harvested at various times after infection (6 to 64 h) or after 1 h of mock infection (M) and detected with primary antibodies specific for the indicated proteins and horseradish peroxidase-conjugated secondary antibodies. Bands were detected via enhanced chemiluminescence. Actin was used as the loading control. Lanes M, mock. (D to F) Total cell RNAs were purified from primary RV and He MEFs that had been mock infected or WNV infected with an MOI of 10 for 12, 24, or 48 h. Q-RT-PCR analysis was performed with inventoried TaqMan gene expression assays (Applied Biosystems) for the Oas1a (D), Oas-like2 (E), and Oas1b (F) genes. The gene for GAPDH was used as an endogenous control. PI, postinfection; RQ, relative quantification.

