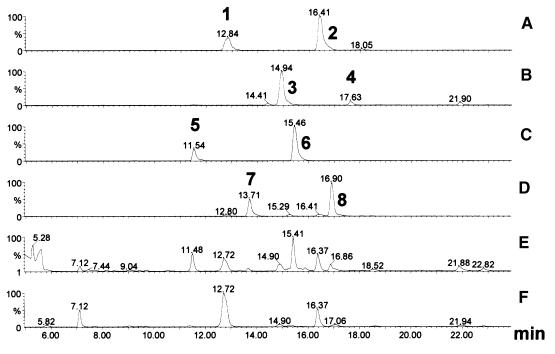
Figure 7.
Liquid Chromatography–Mass Spectrometry Analysis of Benzaldehyde Derivatives.
Positive ion mass chromatograms of the sodium ([M + Na]+) adducts of the molecules of mass 323 (peak 1, 4-hydroxybenzoic acid glucoside; peak 2, 4-hydroxybenzoic acid glucose ester) (A); 353 (peak 3, vanillic acid glucoside; peak 4, vanillic acid glucose ester) (B); 309 (peaks 5 and 6, 4-hydroxybenzyl alcohol glucosides) (C); 339 (peaks 7 and 8, vanillyl alcohol glucosides) (D); and the corresponding UV light chromatograms at 220 nm (E) and 254 to 256 nm (F). The identities of these molecules were confirmed by their characteristic full scan spectra combined with the retention times of known standards. After subtraction of background peaks, the following characteristic mass spectra were obtained (only peaks with intensities >20% of base are reported): peak 1, 323 (100), 139 (67), 121 (22), 95 (70); peak 2, 323 (36), 139 (96), 121 (52), 95 (100); peak 3, 353 (100), 169 (69), 134 (30), 125 (72), 111 (35); peak 4, 353 (100), 125 (27); peak 5, 309 (14), 120 (22), 107 (44), 105 (100); peak 6, 309 (35), 107 (100); peak 7, 339 (70), 137 (100); peak 8, 339 (40), 137 (100).

