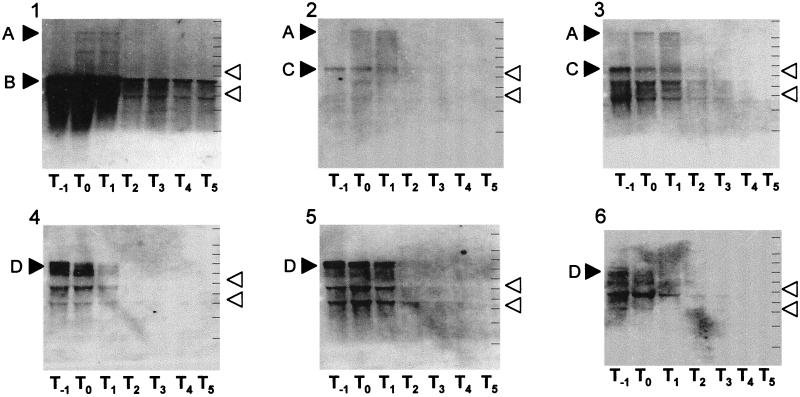
FIG. 3.
Northern blot analysis of transcripts of the prophage 3 region. RNAs were prepared from cells grown in sporulation medium at 37°C, separated by electrophoresis, transferred to nitrocellulose membranes, and hybridized with DIG-labeled probe RNA. The RNA samples used were 20-μg samples. The open arrowheads indicate the positions of 16S rRNA (1.55 kb) and 23S rRNA (2.93 kb). The solid arrowheads indicate the positions of the transcripts detected, as follows: band A, 7.6 kb; band B, 2.2 kb; band C, 2.9 kb; and band D, 4.2 kb. Panel 1, groEL probe; panel 2, ydiO probe; panel 3, ydiP probe,; panel 4, ydiR probe; panel 5, ydiS probe; panel 6, ydjA probe. The lines on the right in each membrane indicate the positions of molecular weight markers (9, 6, 5, 4, 3, 2.5, 2, 1.5, 1, and 0.5 kb). The Tn values below each membrane indicate the numbers of hours (n) after the end of the logarithmic phase of growth.

