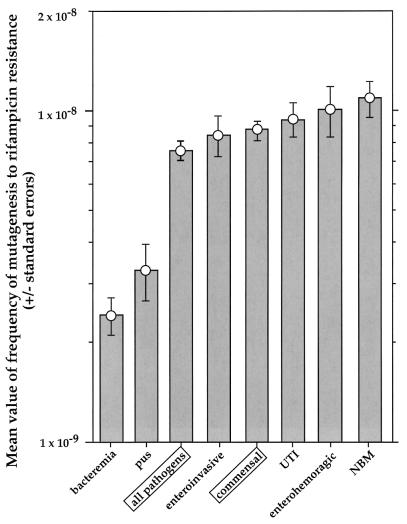
FIG. 2.
Variability of mutation rates of human E. coli and Shigella isolates after elimination of mutators. The mean value (± standard error) of mutation frequency, after removal of those for 10- and 50-fold mutators (see legend to Fig. 1), is shown for each group.

