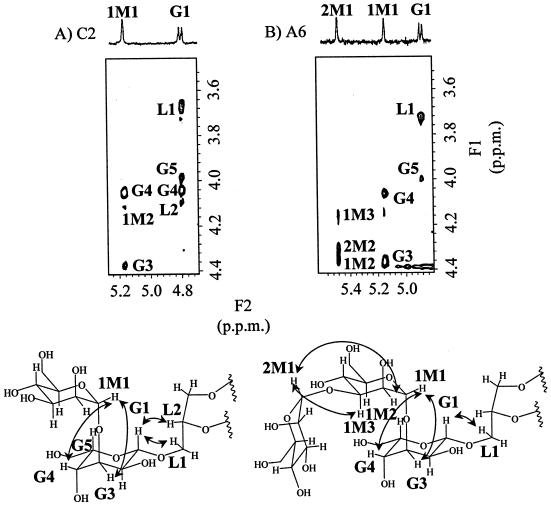
FIG. 5.
ROESY spectra and nuclear Overhauser effect (NOE) correlation of C2 (A) and A6 (B). F1 and F2 axes show proton chemical shifts. ROESY spectra were obtained with data size of 512 by 512 points, and mixing time was 250 ms. Signals of C2 and A6 were accumulated at 320 and 400 scans, respectively. 1H NMR assignments were done using standard methods of correlated spectroscopy and totally correlated spectroscopy (data not shown). The assigned cross-peaks in ROESY spectra are indicated in the structural formulas. NOE correlation involved in conjugation between units is also indicated in the structural formulas by arrows.

