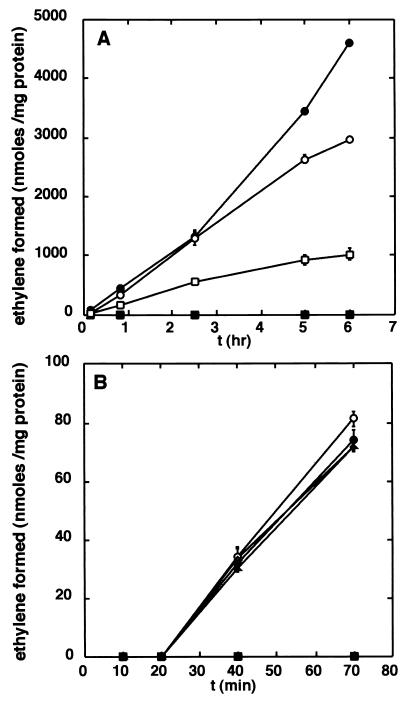
FIG. 1.
Effect of different carbon sources and oxygen concentrations on nitrogenase activity. (A) Nitrogenase activity was determined as acetylene reduction with the following carbon sources and oxygen levels: glucose, 5% oxygen (○); glucose, 20% oxygen (•); pyruvate, 5% oxygen (□); pyruvate, 20% oxygen (▪). Cell density (OD600) = 0.6. Data shown are from four experiments with duplicates for each data point. (B) Reactivation of nitrogenase after inactivation under 20% oxygen. Samples were incubated with 20% oxygen in N2 for 1 h with pyruvate as the carbon source. After an additional 20 min, additions and changes were made. Glucose (○); glucose plus tetracycline (•); ethanol (▵); ethanol plus tetracycline (▴); change of atmosphere from 20 to 5% oxygen in N2 (▪). Data shown are samples run in duplicate from two different cultures. Cell density (OD600) = 0.6. The error bars in both panels show standard deviations.

