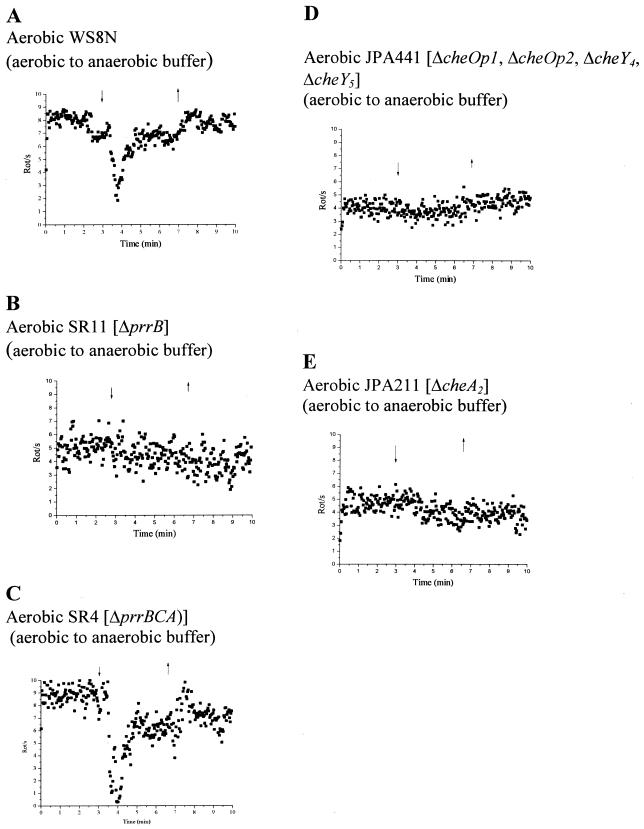
FIG. 3.
Tethered cells analysis of aerobically grown cells to oxygen step changes in a background of 5 mM fructose. (A) Wild type; (B) SR11 (ΔprrB); (C) SR4 (ΔprrBCA); (D) JPA441 (ΔcheOp1 ΔcheOp2 ΔcheY4 ΔcheY5); (E) JPA211 (ΔcheA2). Each graph represents the average behavior of at least 20 cells. The arrows indicate addition (downward arrowhead) and removal (upward arrowhead) of oxygenated buffer.

