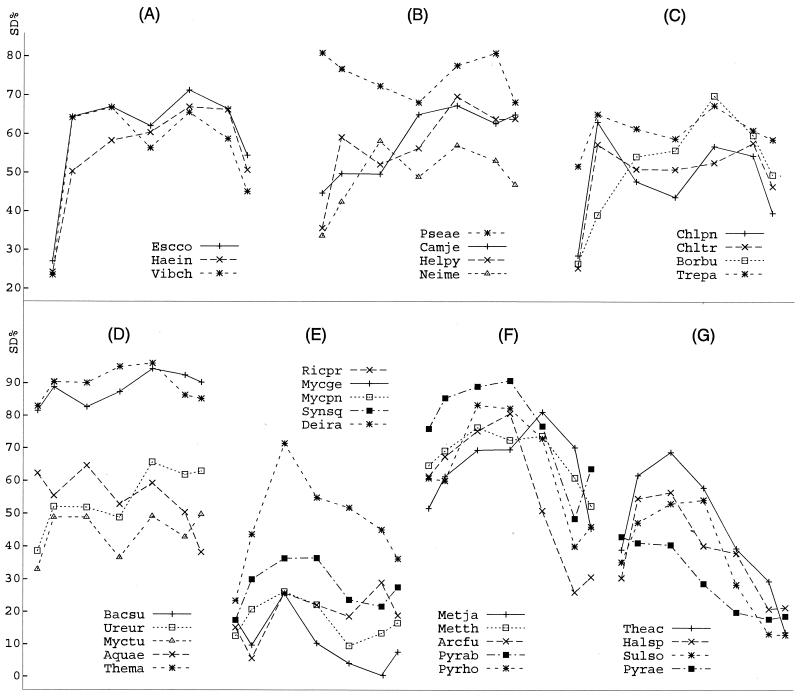
FIG. 3.
Relationship between SD% and distances between successive genes (Dg). The y axis represents SD%. The symbols for the lines and points for each plot are shown. In each plot, the seven data points represent seven Dg groups (from left to right): genes with a Dg of less than −20 bp; five groups of genes with a Dg from −20 to 30 bp, at 10-bp intervals; and genes with a Dg of more than 30 bp (see Supplementary Data Table S-5 for details of the groups). For abbreviations, see the legend to Fig. 2.

