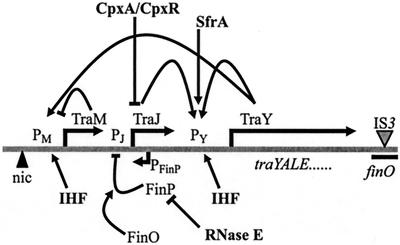
FIG. 1.
Schematic representation of the F tra region, including relevant promoters and genes as indicated. Arrows indicate positive regulatory effects, whereas black bars indicate negative regulatory effects. Plasmid-encoded gene products are shown in regular type, and host-encoded factors are shown in boldface. The drawing is not to scale. Further details are provided in the text.

