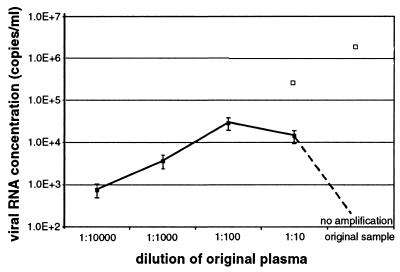
FIG. 1.
Results of quantitative real-time yellow fever virus RT-PCR (5) with original plasma and prediluted plasma. Closed data points depict the viral RNA concentration in plasma, as determined by testing of each dilution step of the patient sample (y axis). In the 1:10,000 to 1:100 dilution steps, the log10 of the determined viral RNA concentration correlated with the dilution factor. Open data points represent the extrapolated RNA concentrations in the undiluted and 1:10 diluted samples, indicating that amplification in these samples was inhibited (note the difference between extrapolated and observed RNA concentration).

