FIG. 9.
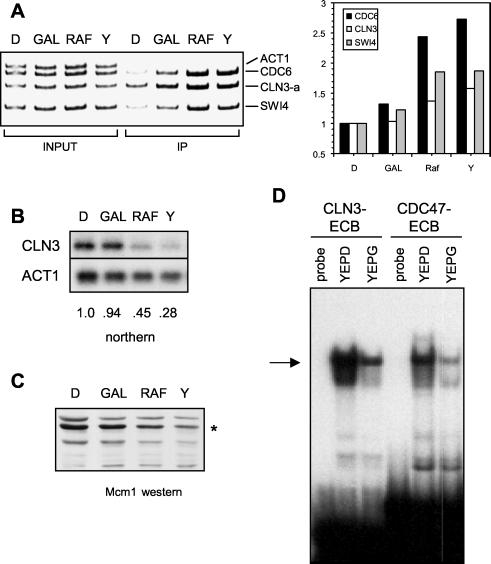
Mcm1-ECB interaction in different carbon sources. (A) Wild-type cells were grown in YEP medium supplemented with 2% glucose (D), galactose (gal), raffinose (raf), or glycerol (Y), and CHIP analysis was performed as described for Fig. 7. At right is shown the data quantified as ratios of the amount immunoprecipitated (IP) over the input and normalized to the value obtained in the glucose-grown cells. (B) Northern blot analysis of cultures used for the CHIP experiments. The blot was sequentially probed for CLN3 and ACT1 and quantified. The ratio of counts in CLN3 over ACT1 is shown below each lane. Because the ACT1 transcript is also lower in cells grown in the poor carbon sources, this value is an underestimate of the reduction of CLN3 mRNA under these conditions. (C) Western analysis detecting Mcm1 protein (asterisk) from extracts of cells grown in the carbon sources indicated. (D) Gel retardation assays using crude extracts from wild-type cells grown in YEP medium supplemented with 2% glucose (YEPD) or 2% glycerol (YEPG) and ECB-containing probes from the CLN3 or CDC47 promoter. The arrow depicts the position of the Mcm1-specific protein-DNA complex, and the first and fourth lanes show the migration of probe alone (probe).

