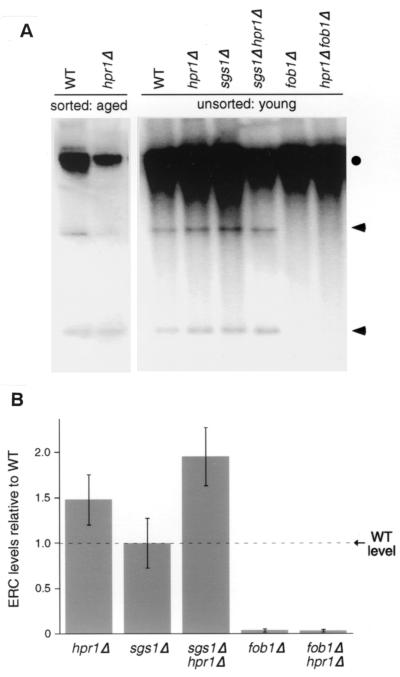
FIG. 2.
ERC accumulation in young and old cells. (A) DNA was isolated from young cells (logarithmically growing cultures) and old cells (ca. 8 to 10 generations old) to determine the levels of ERCs in each strain: wild type (580-10D), hpr1Δ (HFY824-1A), sgs1Δ (RMY059-2B), hpr1Δ sgs1Δ (RMY058-5A), fob1Δ (RMY178-1A), and hpr1Δ fob1Δ (RMY151-11B). Old cells were sorted, and DNA was electrophoresed as described in Materials and Methods. Transfers were probed with rDNA sequence RDN25. The circle indicates chromosomal rDNA; the arrows indicate two identifiable ERC species. (B) ERC levels of each mutant relative to the wild type in young cells. The two visible ERC species were averaged and quantitated against a single-copy chromosomal sequence (ACT1). The levels indicated are the averages from three additional independent experiments. The error bars represent the standard deviations from each set of experiments.

