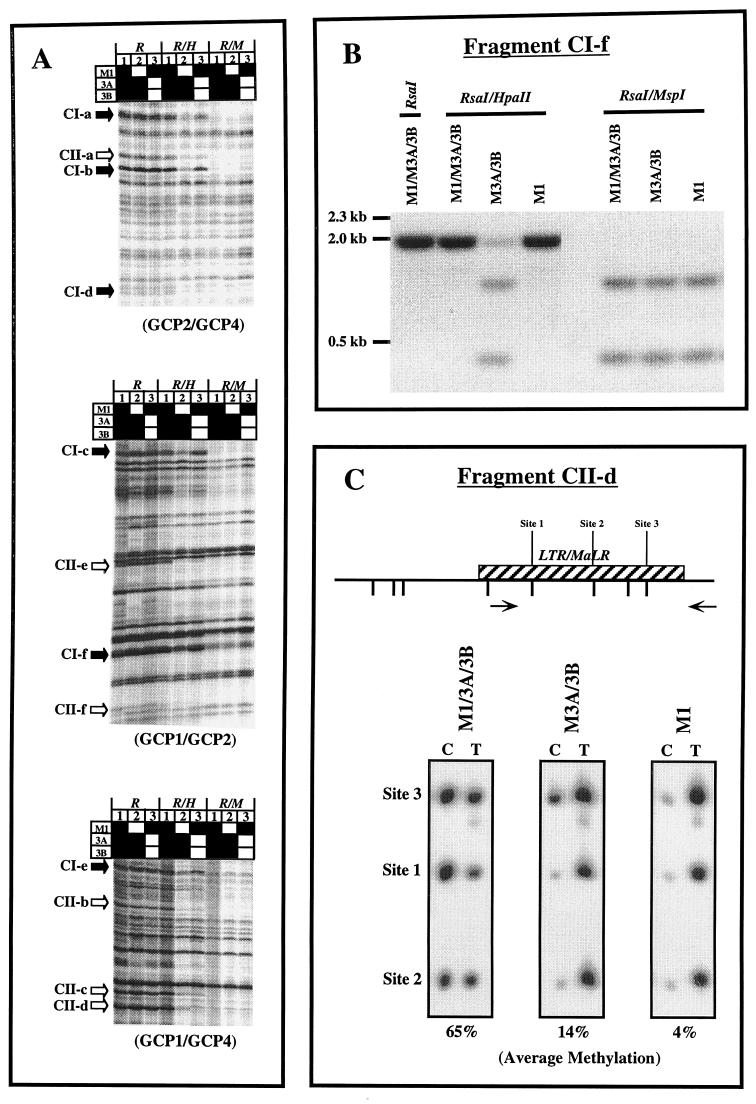
FIG. 1.
(A) Methylation-sensitive fingerprints of M1/3A/3B, M3A/3B, and M1 ES cell DNA after enzyme digestion with either RsaI, RsaI with HpaII, or RsaI with MspI for 16 h. Bands which appear to be hypomethylated only in lane 2 are indicated by solid arrows (class I). Bands which appear to be hypomethylated in both lanes 2 and 3 are indicated by open arrows (class II). Solid squares, functional Dnmt genes; open squares, inactivated genes. GCP1, -2, and -4 are GC-poor primers. (B) Southern blot analysis of genomic DNA from M1/3A/3B, M3A/3B, and M1 ES cells using isolated AP-PCR fragment CI-f as a probe. (C) Ms-SNuPE analysis for fragment CII-d from M1/3A/3B, M3A/3B, and M1 ES cell DNA. Quantitative methylation analysis of three CpG sites in CII-d was performed. The percent methylation given under each gel represents the average obtained for the three sites by using the following equation with PhosphorImager quantitation results: [C/(C + T)] × 100, where C is methylated and T is unmethylated. CpG sites are labeled; hatched boxes, repetitive sequences; arrows, PCR primers.

