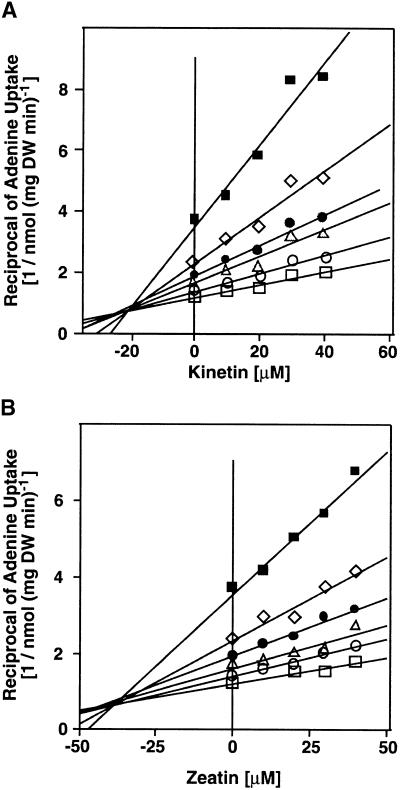
Figure 5.
Competitive Inhibition of Adenine Transport by Kinetin and Zeatin.
Uptake of 14C-adenine (nmol adenine per mg dry weight [DW] per minute) was determined in the presence of the competitors kinetin (A) and zeatin (B) at different concentrations of adenine (5 μM, filled squares; 10 μM, diamonds; 15 μM, filled circles; 20 μM, triangles; 30 μM, circles; and 40 μM, squares). Results are shown as Dixon plots (reciprocal of uptake rate versus inhibitor concentration). Competitive inhibition mode was derived from Lineweaver–Burke plots (data not shown).

