
Fig. 3.
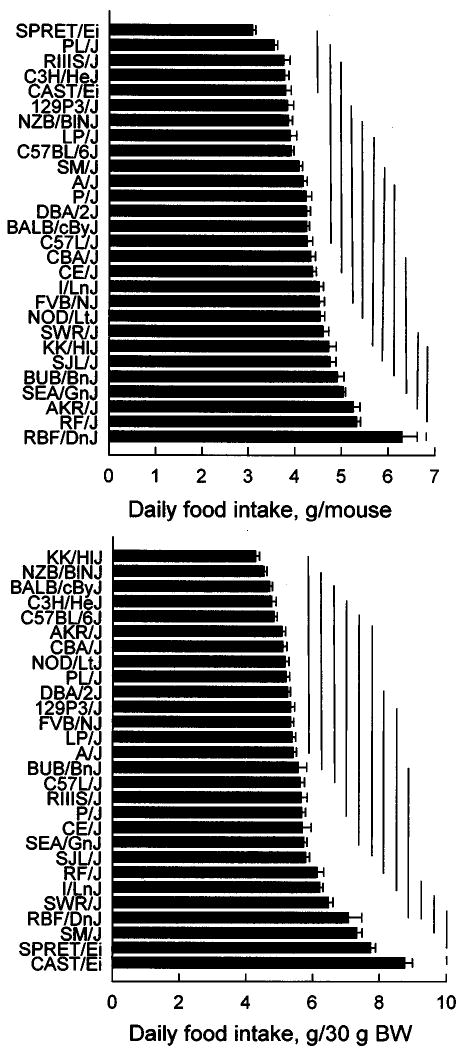
Mean food intakes (top panel) and food intakes adjusted for body weight (BW; food intake/body weight × 30; bottom panel) of 28 strains. Horizontal bars on columns are standard errors of the mean. Bars connected by a vertical line do not differ significantly from each other according to Tukey’s post hoc tests.