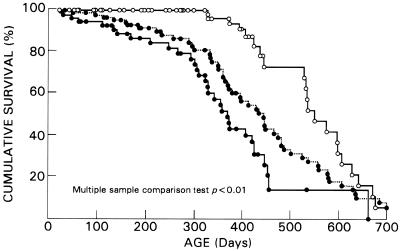
FIG. 2.
Percent cumulative survival analysis of Nhlh1 mutant mice based on a population of 274 animals. Open and closed circles represent wild-type (n = 123) and mutant animals, respectively. For the mutants, the dotted line represents Nhlh1−/− mice (n = 89) and the solid line represents Nhlh1−/− Nhlh2+/− (KH) mice (n = 62).

