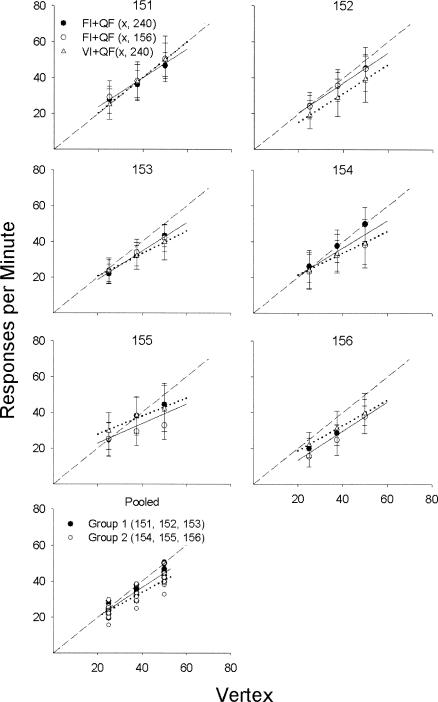
Fig 7. Response rate as a function of the vertex of Equation 3.
Each of the upper six panels represents data for an individual rat. Open and filled circles represent data from FI+QF (x, 156) and FI+QF (x, 240) schedules, respectively, where x was 25, 37.5, or 50 responses per minute, and open triangles represent data from VI+QF schedules. Error bars represent plus or minus one standard deviation. The solid line in each panel represents the best-fitting regression equation for the FI+QF schedules. The dotted line in each panel represents the best-fitting regression equation for the VI+QF schedules. The bottom panel shows the data pooled across the 6 rats. The solid regression line is for Rats 151, 152, and 153; the dotted line is for Rats 154, 155, and 156.

