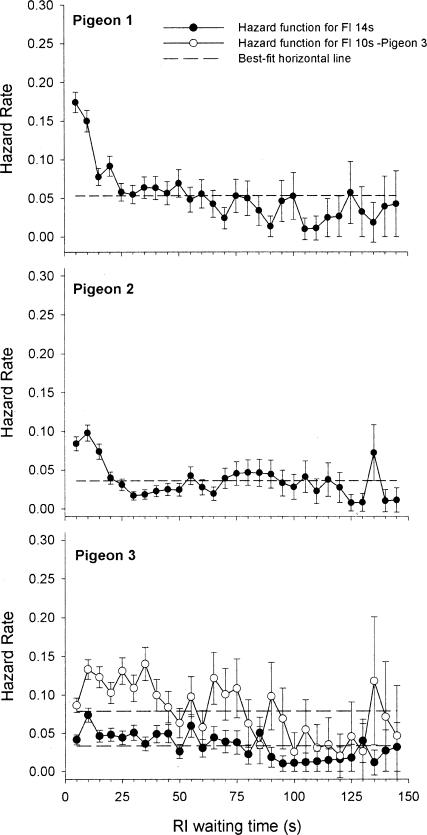
Fig 4. Hazard rate as a function of RI waiting time for all pigeons in the second condition of Experiment 1.
The tics on the x axis correspond to 5-s bins. For Pigeon 3, the two functions correspond to the crf-FI 14-s (closed circles) and the crf-FI 10-s (open circles) phases of the condition. The horizontal dashed lines are best-fit estimates for the exponential model that assumes a constant rate of switching.

