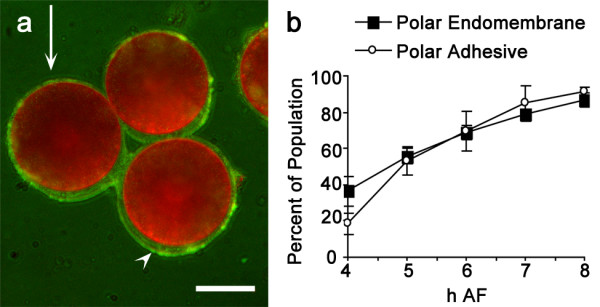
Figure 1.

Endomembrane asymmetry in polarizing zygotes. (a) Zygotes 6 h AF were double labeled with fluorescent microspheres (green) to visualize polar adhesive (arrowhead) and FM4-64 (red) to visualize endomembrane distribution. Arrow indicates direction of orienting light vector and scale bar = 50 μm. Adhesive and endomembranes accumulate at rhizoid (shaded) pole. (b) Time course of photolocalization of adhesive and endomembranes. Y axis indicates percent of zygotes with polar adhesive or polar endomembrane distribution. Over 100 zygotes were scored for each time point and the experiment was repeated three times. Bars are standard errors.
