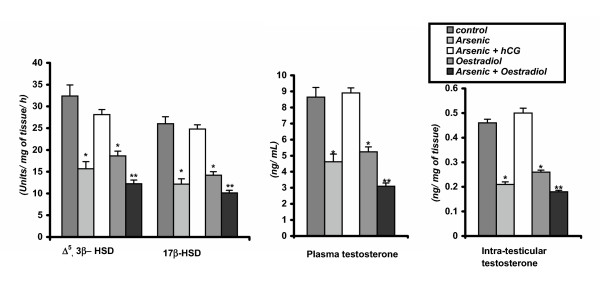
Figure 1.
Testicular androgenic key enzyme activities, plasma and intra-testicular testosterone concentrations in control and different experimental rats. Data as mean + SE, n = 12, ANOVA followed by multiple comparison two- tail t- test (* p < 0.01, ** p < 0.001 as compared with respective control.)

