
Figure 1.
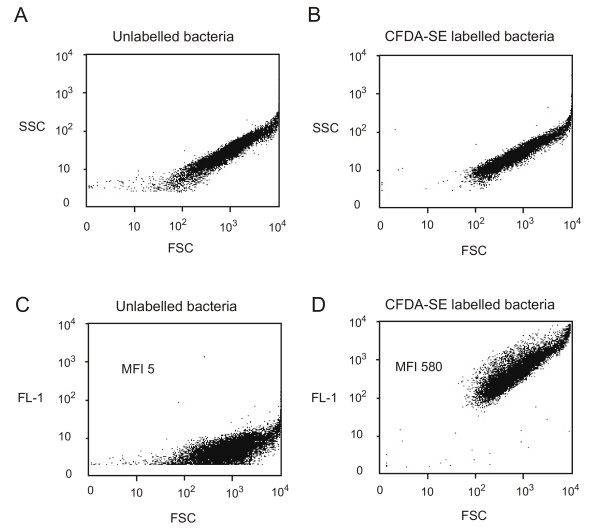
Labelling of the NZ131rgg bacteria with CFDA-SE. Bacteria were grown overnight, washed, labelled with CFDA-SE for 20 min at 37°C, and analyzed with a flow cytometer. (A) Distribution of unlabelled bacteria and (B) of labelled bacteria in the dot plot display mode of forward scatter (FCS) versus side scatter (SSC). The efficiency of the labelling was analyzed by measuring the fluorescence of the bacteria on channel FL1. The labelling of the bacteria is seen as a shift of the bacteria along the FL1 axis in the scatter plot (D). The background fluorescence of the unlabelled bacteria is shown in panel (C) (MFI, mean fluorescence intensity).