
Figure 2. ESI-FTMS spectrum of chondroitinase II.
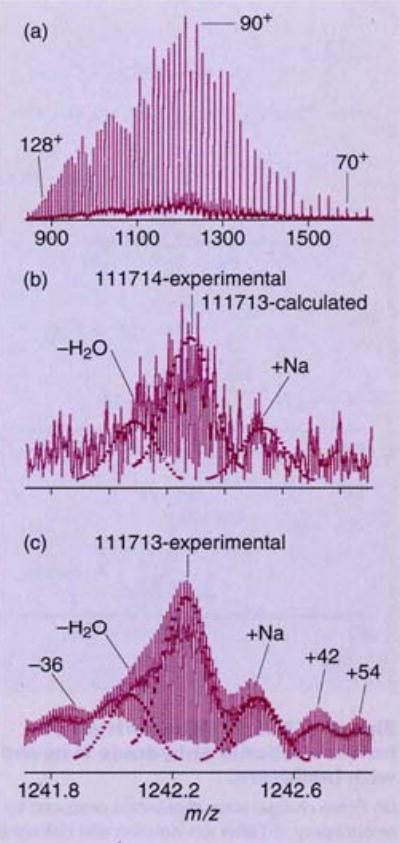
(a) Entire charge-state distribution produced by electrospray, (b) (M + 90H)90+ ions detected over a narrow bandwidth for high resolution, and (c) data from (b) after time-domain sampling, showing isotopically resolved molecular ions, adducts, and fragmentation products. (Adapted with permission from Ref. 9.)