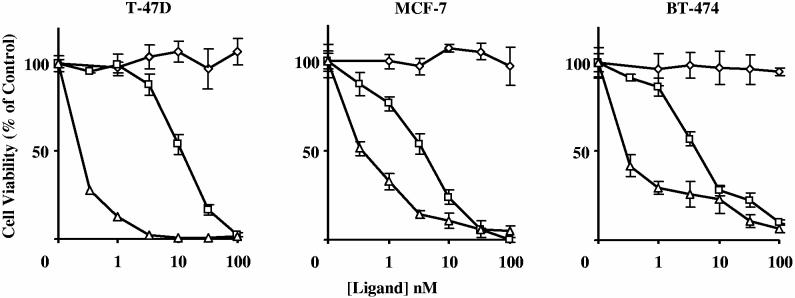
Figure 8.
: Comparison of the response of breast cancer cells to G129R (◇), G129R-PE40-KDEL (□), or wild type PE (△). The viability of three cell lines was examined after 48 h treatment by measuring the reduction of MTS by living cells. Data points presented are representative of the mean + SD from assays performed in quadruplicate on three separate occasions.

