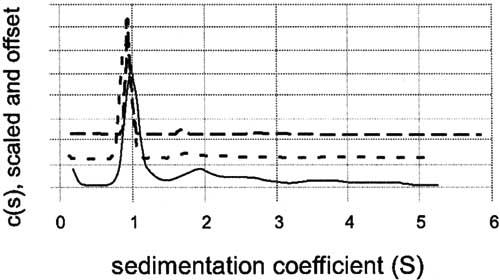
Figure 5.

Analytical ultracentrifugation of purified CTER by velocity sedimentation. CTER was prepared in 50mM Tris-HCl, 150mM NaCl, 1 mM TCEP, pH 7.5 at concentrations of 0.1, 0.3, and 1.0 mg/ml. After reaching temperature equilibrium, the samples were centrifuged at 50,000rpm, and scanned at one minute intervals for 7h. The raw data were analyzed with the Sedfit (version 8.5) program using the model of a continuous distribution of sedimentation coefficients [25]. Distributions for 0.1 mg/ml (solid line), 0.3 mg/ml (short dashed line), and 1.0 mg/ml (long dashed line), are plotted together using an arbitrary y-offset. The data indicate that CTER is monomeric and not undergoing a reversible mass-action equilibrium.
