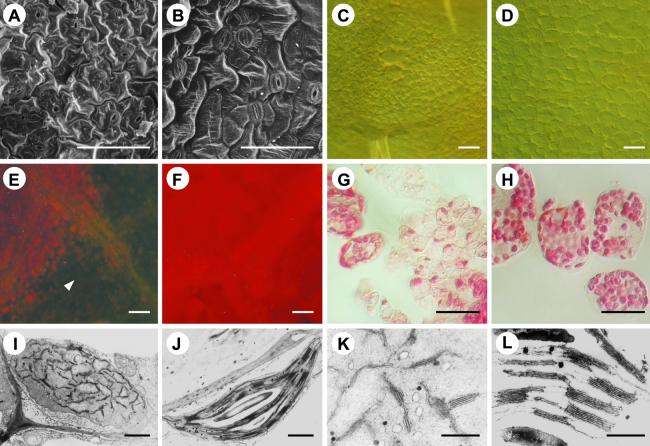
Figure 2.
Light and Electron Microscopic Analysis.
(A) and (B) Scanning electron microscopy of mod1 and wild-type epidermal cells.
(C) and (D) Differential interference contrast microscopy of mod1 and wild-type mesophyll cells.
(E) and (F) A chlorotic sector (arrowhead) of a mod1 leaf (E) shows much weaker red fluorescence than a wild-type leaf (F) under UV light.
(G) and (H) mod1 mesophyll cells (G) contain fewer chloroplasts than wild-type cells (H).
(I) and (J) Transmission electron microscopy of mod1 and wild-type chloroplasts.
(K) and (L) Transmission electron microscopy of mod1 and wild-type thylakoid membranes.
 ;
;  ;
;  .
.

