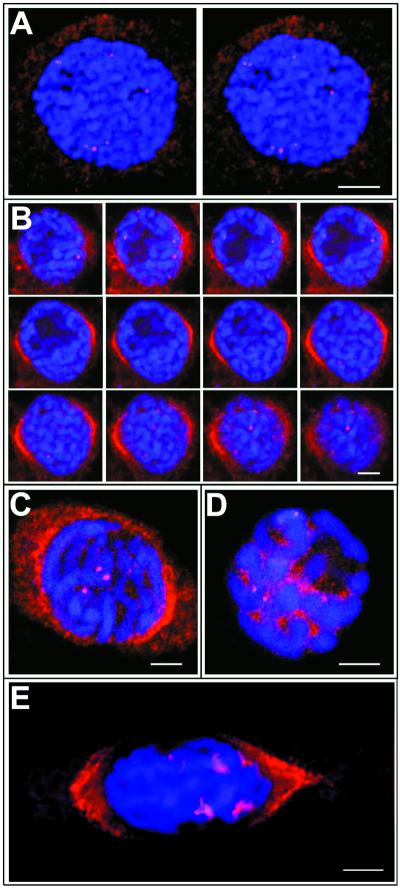
Figure 2.
Confocal Scanning Laser Microscopy of DNA, γ-Tubulin, and MPM2 Staining of Fava Bean Meristem Cells.
Optical sections 1.0 μm thick exhibit γ-tubulin labeling (red) and DNA staining (blue).
(A) Stereopair of a cell in early G2 stage of the cell cycle; stereoimages were obtained by progression through a three-dimensional reconstruction program.
(B) Gallery of 12 optical sections of a cell in late G2 stage of the cell cycle. Note that some of the γ-tubulin–labeled dots are located at the chromosomes near the nuclear envelope, and perinuclear γ-tubulin forms caps that are focused to the poles.
(C) Optical section through a roscovitine-treated cell showing the distribution of γ-tubulin.
(D) Optical section through a roscovitine-treated cell showing the distribution of the MPM2 antigen. Note that the MPM2 signal is associated with the kinetochore/centromeric region and is also seen in the nucleoplasm, whereas γ-tubulin is restricted to the kinetochore/centromeric region.
(E) Cell with prophase spindle and short kinetochore fibers decorated with anti–γ-tubulin antibody.
 .
.

