Figure 4.
Map-Based Cloning of RTM2.
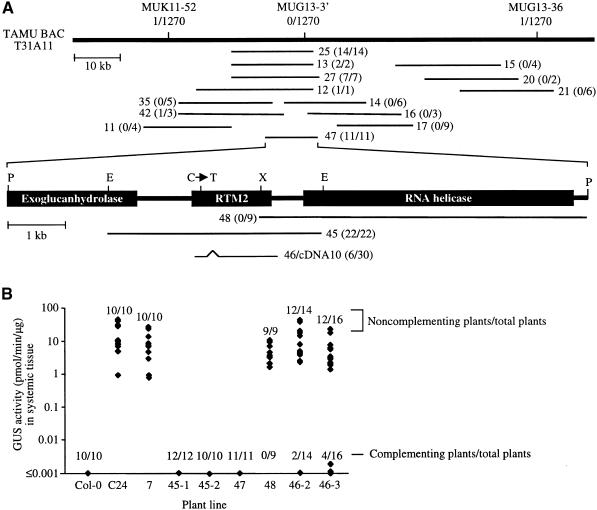
(A) Map of TAMU BAC T31A11, cosmid subclones derived from T31A11 (thin horizontal lines), and putative ORFs around the RTM2 locus (expanded region). Indicated above the T31A11 diagram are the relative positions of markers MUK11-52, MUG13-3′, and MUG13-36 and the number of recombinants identified between each marker and RTM2 in a mapping population containing 1270 chromosomes. The code for each cosmid subclone (e.g., 25) is indicated adjacent to each diagram. The number of rtm2-1–complementing plants per total number of transgenic plants produced with each cosmid is indicated in parentheses. Clone 46 contains an insert from a cDNA library. The position of the C-to-T mutation in rtm2-1 plants is indicated above the RTM2 ORF diagram. E, EcoRI; P, PstI; X, XhoI.
(B) Quantitative GUS activity assays of systemic tissue from TEV-GUS–infected control or transgenic plants containing representative cosmid subclones. Each column contains data from nine to 16 individual transgenic plants or 10 Col-0 or C24 nontransformed control plants. Data from transgenic plants produced by using two independently constructed cosmids 45 and 46 are shown in separate columns. The numbers of susceptible (noncomplementing) and nonsusceptible (complementing) plants per total plants in each set are indicated. The transgenic plants labeled 7 contain an empty cloning vector.

