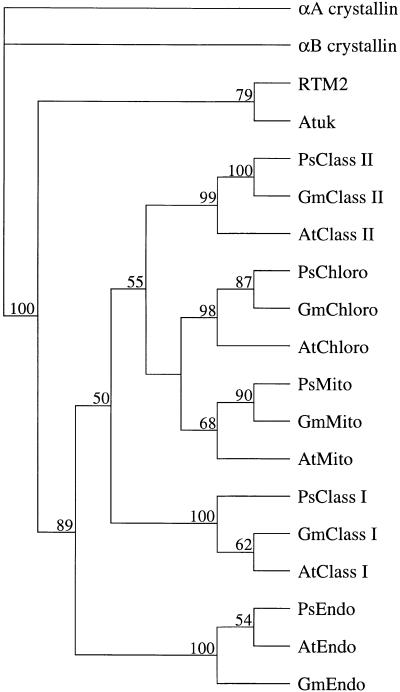
Figure 8.
Cladogram of RTM2, Atuk, and Small HSPs.
The α-crystallin–like domains were aligned as in Figure 6 and assembled into a single tree by a heuristic search using bootstrap analysis (100 replicates) with simple sequence addition, tree bisection-reconnection branch swapping, steepest descent off, and MULPARS on in PAUPsearch and PAUPdisplay. The human αA-crystallin and αB-crystallin sequences were assigned to the outgroup. The numbers above branch points indicate bootstrap percentage values. Abbreviations and the GenBank accession number for each sequence other than αA-crystallin (P02489) and αB-crystallin (P02511) are given in the legend for Figure 6.

