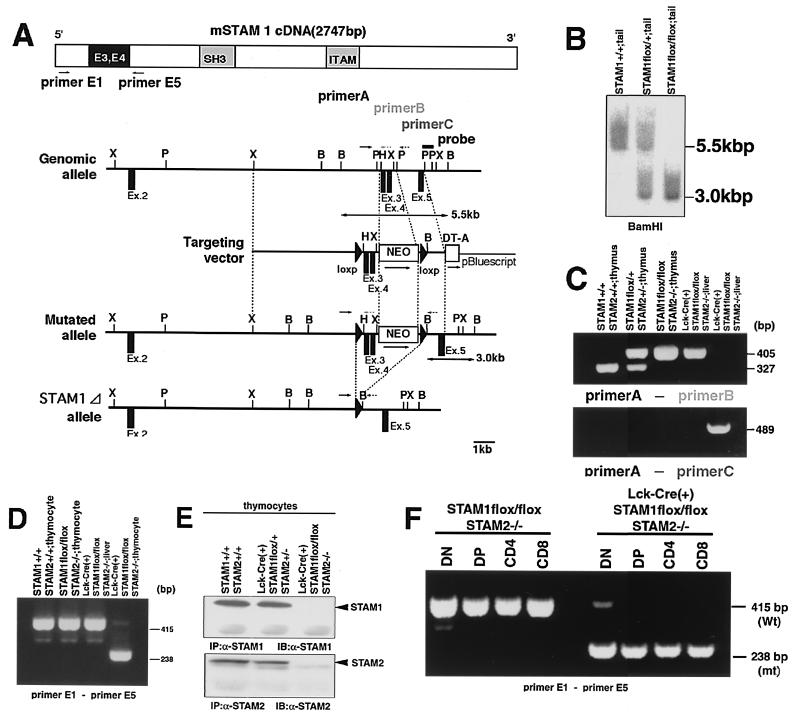
FIG. 1.
Generation of T-cell-specific disruption of both STAM1 and STAM2 genes. (A) Schematic representation of the mSTAM1 cDNA, stam1 genomic locus, targeting vector, and mutated stam1 locus. The positions of stam1 axons are shown as boxes. Restriction sites: B, BamHI; H, HindIII; P, PstI; X, XbaI. (B) Southern blot analysis of the stam1 mutation in mice. Arrows indicate the position of the DNA fragments corresponding to the wild-type (5.5-kb) and mutated (3.0-kb) alleles. (C) PCR analysis of genomic DNA from thymus and tail. PCR primers used are shown in panel A. (D) RT-PCR analysis of total RNA from thymocytes and liver. The primers used are primers E1 and E5, shown in panel A. Note that a shorter PCR product (238-bp) was amplified from Lck-Cre (+) STAM1 lox/lox thymocytes. (E) Immunoprecipitation analysis for STAM1 and STAM2. Lysates of thymocytes from Lck-Cre (+) STAM1+/+ STAM2+/+, Lck-Cre (+) STAM1flox/+ STAM2+/−, and Lck-Cre (+) STAM1flox/flox STAM2−/− mice were immunoprecipitated and then immunoblotted with anti-STAM1 Ab or anti-STAM2 Ab. (F) RT-PCR analysis of total RNA from each thymocyte fraction.

