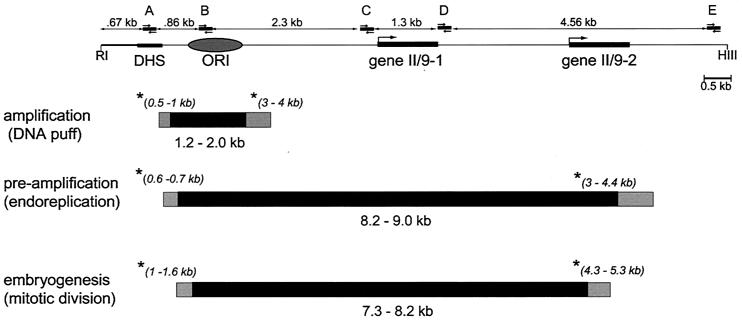
FIG. 2.
The initiation zone for replication at locus II/9A changes during development. (Top) Map of locus II/9A in Sciara. The DHS occurs concurrently with replication (94), ORI designates the 1-kb amplification origin mapped by 2D and 3D gels (59, 60), and genes II/9-1 and II/9-2 are transcription units from this locus (27). The positions of the five primer pairs (A to E) are shown, as are EcoRI (RI) and HindIII (HIII) restriction sites that flank this 11-kb region. (Bottom) Schematic drawings of the initiation zones calculated from data in Fig. 3. The nascent DNA fractions used to calculate the boundaries of the initiation zones are marked with an asterisk, and the nascent DNA size of that fraction is shown in parentheses. The black area is the initiation zone if the higher value for the smallest detectable nascent DNA is used for the calculation, whereas the gray area delimits the initiation zone calculated from the lower value for the smallest detectable nascent DNA.

